

New Home Sales Slip as the South Cools, While New York-Area Prices Keep Rising
September's sales pace dipped 0.6 percent on weakness in the South, and the Case-Shiller index showed the New York area up 6.2 percent over the year.
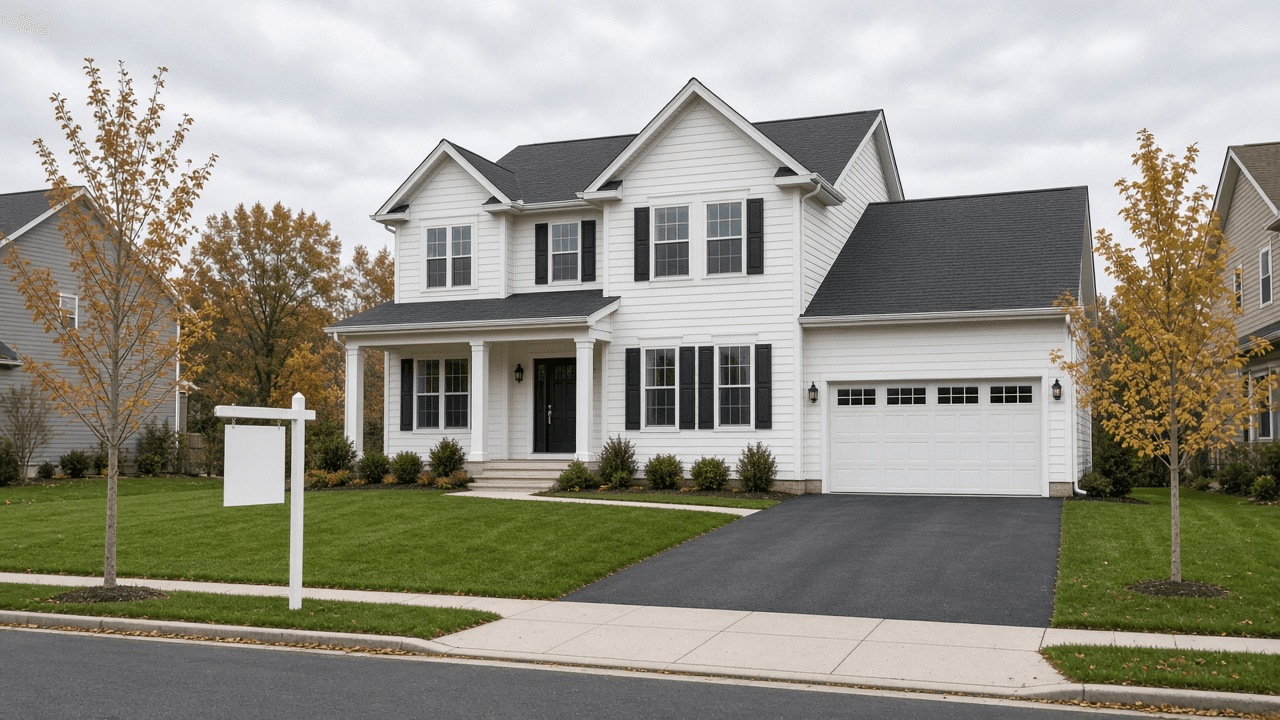
Builders sold new homes at a slightly slower clip in September, with nearly all of the weakness concentrated in the South. Separate data out Tuesday showed resale prices still climbing through the summer, which leaves buyers facing the same mix of high costs and high borrowing rates they have dealt with all year.
Federal estimates put last month's pace of new single-family home sales at 676,000 a year, adjusted for seasonal swings. That was 0.6 percent under August's revised 680,000 and 5.3 percent behind the pace of a year ago. The agencies' own margin of error on the monthly change is close to 14 percentage points either way, so they could not say with confidence whether sales actually fell.
Where the drop did show up was in the South, which accounts for most new construction. August had brought a pace of 442,000 there; September's 413,000 marked a 6.6 percent drop and the region's softest month since May. Even so, the region still made up roughly six of every 10 new homes sold nationally. The other regions moved in different directions. Two regions moved the opposite way: the West climbed to 142,000, a 21.4 percent gain, and the much smaller Northeast reached 32,000, up 28 percent. The Midwest, at 89,000, lost 7.3 percent.
Supply barely changed. Builders were carrying an estimated 476,000 unsold new homes as September closed, about 1 percent fewer than in August. Selling at September's rate, clearing them would take 8.4 months' worth, a level the home builders' trade group described as elevated.
On price, the new-home data cut both ways. The median sale price was $400,400, up 3.9 percent from August but down 3.9 percent from September 2025, and the government's error bands on both changes include zero. Changes in which homes happen to sell, by region or size, can move the median without any builder cutting a price.
The broader resale market looks firmer. Case-Shiller's national index, published by S&P Cotality, tracks repeat sales of the same houses, and it rose 2.1 percent in August from a year earlier, a faster gain than July's 1.9 percent. The 20-city measure climbed 2.7 percent and the 10-city measure 3.6 percent.
The New York area was among the hottest markets. Its prices rose 6.2 percent over the year, second only to Chicago's 6.7 percent among the cities tracked, with Cleveland third at 4.3 percent. Seattle was at the bottom, down 2 percent.
Those gains still trailed inflation. Consumer prices were up 3.4 percent from a year earlier in August, so home values fell after adjusting for inflation for a 15th consecutive month, the index's sponsor said.
Rebecca Kaufman of S&P Dow Jones Indices, where she is an associate director, put it plainly: "Affordability, however, remains challenging." "With inflation at 3.4%, Brent crude near $100 per barrel and mortgage rates in the mid-to-high 6% range, households continue to face elevated costs alongside persistently high home prices."
Borrowing has since become more expensive than the range she described. In Freddie Mac's weekly survey, a typical 30-year fixed loan carried a 7.32 percent rate for the survey week through Oct. 22. That was 0.08 point lower than the prior week but more than a full point above the 6.19 percent rate of October 2025.
Other figures out Tuesday pointed to a business sector that is still spending. Factory orders for long-lasting goods rose 1.8 percent in September to $345.4 billion, with transportation equipment doing most of the lifting, Census figures showed. Core capital goods orders, which leave out aircraft and military gear and are watched as a gauge of business investment, gained 0.5 percent after a 1.6 percent rise in August.
For buyers on Long Island, the New York-area price figure is a closer guide than the national count of new homes sold. The New York area's gain of more than 6 percent is roughly three times the national pace, and it comes with mortgage rates above 7 percent.
OneKey MLS, the multiple listing service for the region, counted 757 single-family closings in Nassau County in September, 4.1 percent fewer than a year before, while the county's median price rose 2.1 percent to $860,000. Suffolk went the other way on volume, with closings up 4.6 percent to 1,041, and its median climbed 2.8 percent to $740,000.
Census plans to publish October's new-home figures on Nov. 25.
You Might Also Be Interested In

Hochul Ranked Worst Governor in America
Micron Needs Power Albany Is Rationing

Albany Retreats on One Piece of Its Native Mascot Ban